Exploring Our Infrastructure and Design
Now that we understand the goal of the lab, the solution we want to implement, and the existing limitations, it is time to focus on the infrastructure we will be working with. As we have mentioned before, this infrastructure consists of two key components: the autonomous vehicle and the re-training machine.
Autonomous vehicle (RHDE)
Our autonomous vehicle, runs on a RHEL 9.6 operating system where we have deployed MicroShift. This MicroShift instance also comes with the AI model serving component and gitops service enabled. The model serving platform will be used to load and serve the AI models for inference. Also, in this machine we will deploy MinIO storage dedicated to storing AI models used for battery stress and fault detection. By default, two baseline models are preloaded at startup. These will later be replaced by the retrained models coming from our Single Node OpenShift instance. Additionally, our Battery Monitoring System application will also run on this vehicle, making use of the trained models to provide predictions through the telemetry dashboard along with the data generated.
Re-training Node (SNO)
This is a single-node deployment of OpenShift that will serve as the primary platform for re-training and validating our AI models in an automated manner thanks to Red Hat OpenShift AI. This single node is located outside our vehicle in the plant.The sensor data will be collected from the InfluxDB component in the MicroShift instance and used to re-train the models. Also, another MinIO storage intance is already deployed in our SNO and will be used to store pipeline artifacts.
Solution Workflow
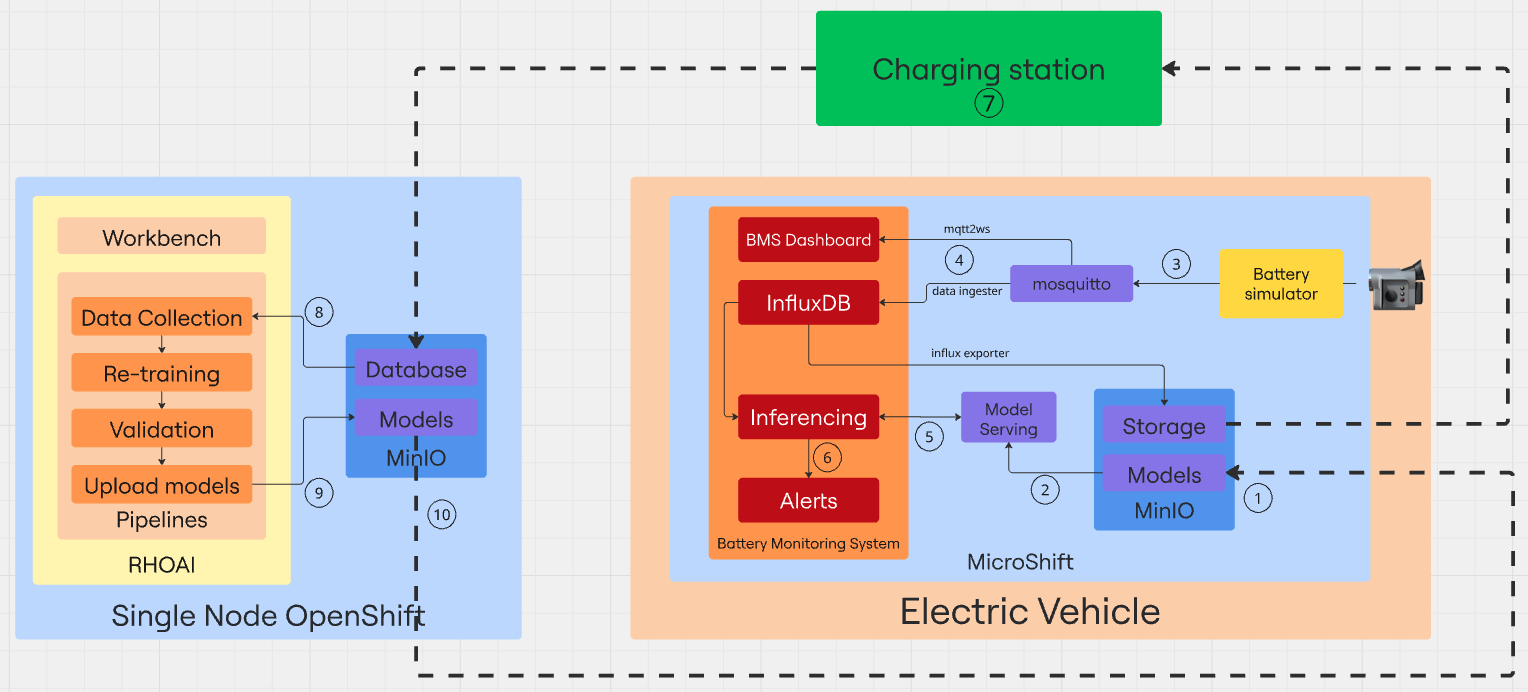
Sometimes, a picture is worth a thousand words. Below, you will find a diagram illustrating the main components involved in our solution:
-
(1) Our environment comes with two base AI models stored in the inference MinIO bucket. The first one called Stress detection will be able to identify early signs of battery stress-conditions that may lead to degradation or failure. The second one - Time to Failure - uses sensor data to provide an estimate of the remaining time until a potential battery failure.
-
(2) Both models are loaded into the InferenceServer instance to make them available for inference via API endpoints.
-
(3) Once the infrastructure is ready, it’s time to start generating data. The Battery simulator item is a Quarkus component that simulates the battery consumption of an operating autonomous vehicle and sends telemetry data to the Mosquitto MQTT broker that acts as the central messaging hub, receiving the data coming from the emulated sensors.
-
(4) Two different Camel Quarkus components are in charge of reading the data from Mosquitto and send it to the Battery Monitoring System (BMS) app. The mqtt2ws exposes the data as Websocket for the BMS Dashboard and the data ingester stores it in InfluxDB. From there, a scheduled pipeline running every 10 minutes in the SNO, collects all the data stored in the time series database during the last hour and is used to re-train both models.
-
(5) The Battery Monitoring System application includes a component that retrieves real-time data from InfluxDB and sends it as queries to the two inference endpoints and receives the predictions from the AI models currently being served.
-
(6) The response returned by the models is analyzed, and if necessary, it is forwarded to an alerting system that triggers notifications in case of detected battery stress conditions or signs of an imminent failure.
-
(7) Every 10 minutes, a pipeline is triggered to collect the data, retrain the model, and compare its performance against the existing one. All in a fully automated manner.
-
(8) If the comparison results show that the new models perform better, they are sent back to the inference MinIO bucket in the autonomous vehicle, so the cycle can start again with the updated models.