Deploying the Battery Monitoring System
In this final section, we will deploy the Battery Monitoring System (BMS) application that brings together all the components we’ve previously deployed. The BMS serves as the main interface for monitoring battery health in our autonomous vehicle, providing real-time telemetry data visualization and AI-powered predictions.
Deploying BMS using GitOps
Again, we will use GitOps to deploy all the Battery Monitoring System components:
Step 1: Deploy GitOps Application
Deploy the Battery Monitoring System GitOps application:
oc apply -f - <<EOF
apiVersion: argoproj.io/v1alpha1
kind: Application
metadata:
  name: battery-simulation
  namespace: openshift-gitops
spec:
  destination:
    server: https://kubernetes.default.svc
    namespace: battery-demo
  source:
    path: bootstrap/battery-simulation/groups/dev
    repoURL: https://github.com/rhpds/ai-lifecycle-edge-gitops.git
    targetRevision: main
    kustomize:
      patches:
        - target:
            kind: ConfigMap
            name: bms-dashboard-config
          patch: |-
            - op: replace
              path: /data/config.json
              value: |
                {
                  "BATTERY_METRICS_WS_ENDPOINT": "wss://mqtt2ws-microshift-001.{openshift_cluster_ingress_domain}/battery/metrics/",
                  "OPEN_AI_API_KEY": "my-key",
                  "STRESS_DETECTION_AI_API_ENDPOINT": "https://stress-detection-predictor-microshift-001.{openshift_cluster_ingress_domain}/",
                  "TIME_TO_FAILURE_AI_API_ENDPOINT": "https://time-to-failure-predictor-microshift-001.{openshift_cluster_ingress_domain}/",
                  "BATTERY_SIMULATION_API_ENDPOINT": "https://battery-simulation-microshift-001.{openshift_cluster_ingress_domain}/",
                  "AUTO_INFERENCE_INTERVAL_MS": 30000
                }
  project: default
  syncPolicy:
    automated:
      prune: true
      selfHeal: true
EOF
Monitor the deployment progress to ensure all BMS components are properly deployed:
watch oc get pods -n battery-demo|
You can exit the watch command by pressing Ctrl+C in your keyboard. |
When all pods show Running status, the Battery Monitoring System deployment is complete.
The GitOps Application will deploy the following BMS components:
-
Namespace: A battery-demo namespace that contains all BMS-related resources, providing isolation for the monitoring system.
-
Battery Simulator: A Quarkus component that simulates battery behavior and generates realistic telemetry data including voltage, temperature, driving distance, or velocity.
-
MQTT Broker: A Mosquitto MQTT broker that acts as the central messaging hub, receiving sensor data from the battery simulator and distributing it to other components.
-
Data Processing Components: Two Quarkus services that process MQTT data:
-
mqtt2ws service that exposes data as WebSocket for the BMS dashboard
-
data ingester service that stores sensor data in InfluxDB time series database
-
-
InfluxDB: A time series database that stores historical sensor data for analysis and monitoring.
-
BMS Dashboard: A web-based dashboard that displays real-time battery telemetry data and AI predictions.
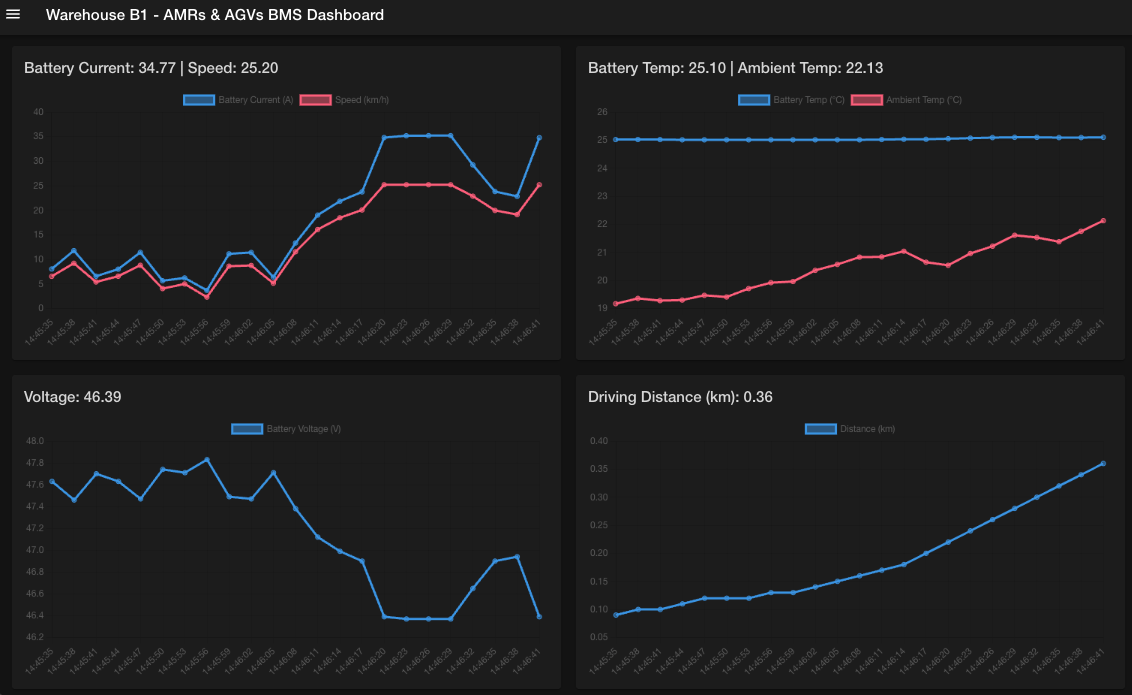
Step 2: Access BMS Dashboards
Once deployed, you can access the Battery Monitoring System dashboard:
https://bms-dashboard-microshift-001.{openshift_cluster_ingress_domain}The dashboard will display real-time battery telemetry data, AI predictions for stress detection and time-to-failure, and provide alerting capabilities for battery health monitoring.
Also you can access the InfluxDB dashboard where the sensor data es collected and prepared to be sent to the BMS dashbaord.
https://influx-db-microshift-001.{openshift_cluster_ingress_domain}Use the following credentials to log in:
-
Username:
admin -
Password:
password
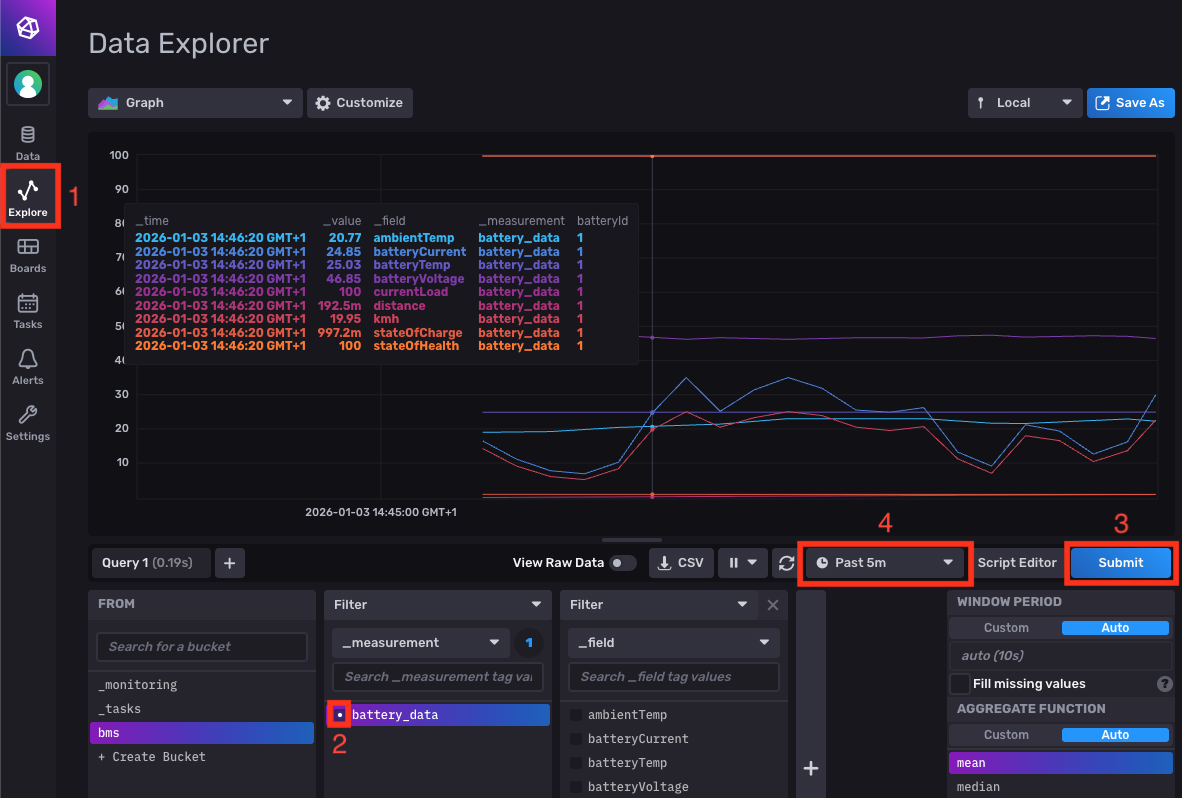
To verify the data stream:
-
Navigate to Explore in the left-hand menu.
-
Select the bms and battery_data filters at the bottom.
-
Click Submit to execute the query.
Data will start appearing from the right side of the screen. If you recently deployed the BMS app, the data may be difficult to see, so you can adjust the time interval to expand the graph. The following image shows data generated over the past 5 minutes: